Archives for September 2016
Best Ideas (Part II) from the Morningstar ETF Conference
 On September 8, Steve Blumenthal appeared on a panel regarding portfolio construction (“Beyond the 60/40 Portfolio”) at the Morningstar ETF Conference in Chicago.
One of Steve’s favorite sessions was the “Best Ideas” panel, which featured Mark Yusko of Morgan Creek Capital Management, John West of Research Affiliates, and Rich Bernstein of RBA. Steve shared Part I of his notes from the Best Ideas panel in the September 16, 2016 edition of On My Radar.
Steve shared Part II of his notes in Friday’s On My Radar. Read on!
READ MOREGlobal Debt Jubilee?
When you borrow from tomorrow to spend today, that leveraged spending is good for growth. At some point, you reach an end to just how much debt you can take on. Reinhart and Rogoff suggest that threshold, based on hundreds of years of study, is 90% debt-to-GDP. At some point, you cross a line. Take a look at the chart below.

I believe we are in a low growth, deflationary-pressured world until we solve and reorganize the debt mess. A global debt jubilee? We have a serious problem to solve and there is little motivation at this point to get started. The markets may just force that hand.
READ MOREBest Ideas from the Morningstar ETF Conference
 On September 8, I had the privilege of participating on a panel regarding portfolio construction (“Beyond the 60/40 Portfolio”) at the Morningstar ETF Conference in Chicago. Not surprisingly, there were a lot of terrific discussions, and I took tons of detailed notes. One of my favorite sessions was the “Best Ideas” panel, which featured Mark Yusko of Morgan Creek Capital Management, John West of Research Affiliates, and Rich Bernstein of RBA. Morningstar’s Jeff Ptak did a great job moderating the panel.
As promised, I shared some of my notes from the Best Ideas panel in Friday’s On My Radar. More to come from the conference later this week. Stay tuned!
READ MOREElliott Management’s Paul Singer Warns of “Dangerous Time” in Global Financial Markets
In the August 19, 2016, issue of On My Radar, Steve Blumenthal cited a CNBC article discussing Elliott Management’s quarterly investor letter by Paul Singer, which predicted a forthcoming market “breakdown.” Singer contends that the global bond market is “broken.”
Today, at CNBC’s Delivering Alpha conference, Singer criticized central bankers and specifically the Federal Reserve saying, “What they have done is created a tremendous increase in hidden risk, risk that investors don’t exactly know or have faced about their holdings. I think it’s a very dangerous time in the global economy and global financial markets.”
In these volatile, unpredictable times, advisors need to know that someone has their back. We’ve got your back. CMG is here to serve our clients, exceed their expectations and help build the strongest all-weather portfolios possible. Contact us today.
Mauldin’s “Monetary Mountain Madness”
If you read just one piece this week, read John Mauldin’s “Monetary Mountain Madness.”
John’s promise: “I trust that by the end of this letter you will better understand just how bankrupt – and disastrous – what passes for sound economic thinking among the world’s central bankers actually is.”
Terrific article!
Trade Signals – Sentiment Better, Risk On Remains
With a nod towards broad portfolio diversification, following is a quick summary of what I am seeing this week — organized by investment category (equity markets, fixed income and liquid alternatives):
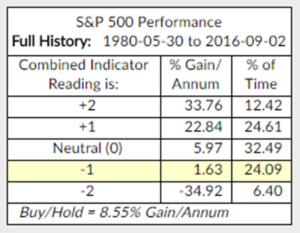
Equity Markets: Investor Sentiment moved from excessive optimism to neutral. The trend remains positive. Supply and demand continues to evidence more buyers than sellers (a bullish signal). Don’t Fight the Tape or the Fed moved from 0 to -1. This next chart shows us why we want to watch out for -2 (an unfavorable trend and unfriendly Fed environment):
The 13/34-Week EMA trend indicator remains bullish. The CMG NDR Large Cap Momentum Index is nearing a buy signal; its model trend line is bullish.
A quick note on the chart above: NDR shows price appreciation and not total return. So, the Buy/Hold + 8.55% Gain/Annum would be higher with dividends added in. That would be more informative; however, since we are comparing the price appreciation in each zone (+2, +1, Neutral (0) as reflected), I believe the data is telling and useful in giving us a sense for which environments suggest more or less risk. Actual returns in each category are higher. A thank you to an astute reader.
Fixed Income: The 10-year Treasury Yield is back down to 1.52%. Money is voting with its pocket… saying the Fed won’t raise rates. The Zweig Bond Model remains bullish on bonds and our HY remains in a buy signal. The underlying HY fundamentals are terrible; however, this is another good example where trend following can be a good friend. We will ride the uptrend until it reverses. Further, we see “JNK” and “PCY” exhibiting the strongest relative strength in fixed income (this from a universe of nine ETFs ranging from short-term and long-term Treasury bonds, corporate bonds, munis, high yield, emerging market, inflation and developed market bonds).
Liquid Alternatives: The CMG Opportunistic All Asset ETF Strategy is currently allocated approximately 81% to equities and 19% to fixed income. We are seeing strong relative price leadership in “EEM” (Emerging Markets), “VT” (Vanguard Total World Stock ETF), “QQQ” and “IYW” (Technology ETFs) and “IYF” (U.S. Financials). Our two fixed income ETFs, “EDV” (Vanguard Extended Duration Treasury) and “TLT” (iShares 20+ Year Treasury Bond), have rallied nicely. Biotech looks to be recovering from the Hillary Clinton statements. For weightings by asset class, please see the CMG Opportunistic All Asset Strategy pie chart below. Gold (“GLD”) looks to have held support at 125. The cyclical trend for gold remains higher as evidenced by the Gold chart you’ll find in the full post (link below).
For charts, analysis, and commentary see the rest of the story in Trade Signals — Sentiment Better, Risk On Remains.
The current opinions and forecasts expressed herein are solely those of Steve Blumenthal and are subject to change. They do not represent the opinions of CMG. CMG’s trading strategies are quantitative and may hold a position that at any given time does not reflect Steve’s forecasts. Steve’s opinions and forecasts may not actually come to pass. Information on this site should not be used as a recommendation to buy or sell any investment product or strategy.
Current High Valuations Suggest Low 10-Year Returns for Stocks
Both professional and individual investors must recognize the relationship between risk and reward (i.e., returns). Indeed, as fiduciaries, investment advisers are duty-bound to protect their clients’ interests and elevate them above their own. We’ve been writing for some time that current market valuations are very high and, when the market is at these excessive levels, returns are typically reduced.
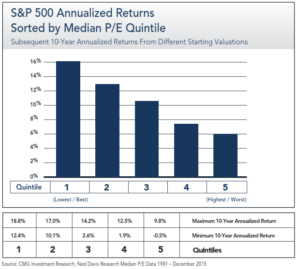
On August 31, the S&P 500 median price-to-earnings (P/E) ratio was 23.7. (Think of “median P/E” (which is based on actual, reported earnings and current share price) as the middle P/E (250 stocks have a lower P/E and 250 have a higher P/E).)

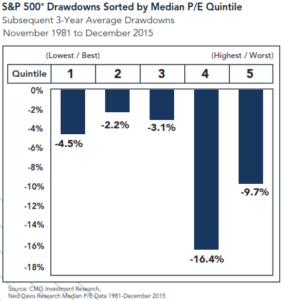
I’ve shared the chart above previously. It shows that returns are highest when the market is most favorably priced (low median P/Es) and lowest when the market is least favorable priced (high median P/Es). We are in Quintile 5 today. The next chart shows that not only were returns lowest when P/Es are high, like they are today, the risk is actually the highest.

In fact, some investment managers, are further lowering forward return expectations for equities. GMO recently revised its real return forecast for large-cap equities to -3.2% from -1.9.

For charts, analysis, and commentary, see the rest of the story in On My Radar: Why? Because We Need the Eggs
The current opinions and forecasts expressed herein are solely those of Steve Blumenthal and are subject to change. They do not represent the opinions of CMG. CMGs trading strategies are quantitative and may hold a position that at any given time does not reflect Steve’s forecasts. Steve’s opinions and forecasts may not actually come to pass. Information on this site should not be used as a recommendation to buy or sell any investment product or strategy.
Why I Don’t Follow Consensus Earnings Estimates
I bet that you, like me, get a number of client calls that reference a Wall Street report touting forward P/Es. The client watched an analyst on TV saying P/Es are cheap based on next year’s earnings estimates. The analyst compared that forward estimate based P/E, which is 17.20 as of August 31, 2016, to 23.7 (median P/E) or 26 (Shiller P/E) and says the market is not so richly priced.
Not only is that poor analysis, if you look at forward P/E and compare it to other periods in time, you’ll see that the current level is as high as it was in 2007 and higher than any other period since the 1960s with the exception of the late 1990s and early 2000s.
With that said, here is the main reason I don’t rely on Wall Street “consensus” earnings estimates. The next chart shows year by year where Wall Street’s estimates began and where they finished up. For example, look at the 2016 estimates (orange line). Back in March 2015, the consensus earnings estimate for 2016 was approximately $137.50 in operating earnings per share for the S&P 500. The most recent estimate, as of August 24, 2016, is $110.84 per share.

Take a look at each year. Note how it started high and how much it declined by the time the actual numbers were reported. Keep in mind we won’t know 2016 numbers until Q1 2017. And we won’t have 2017 numbers until Q1 2018. My simple point is… how can we rely on forward P/E based on Wall Street’s earnings estimates? I can’t.
Click here to find out what actually happened with consensus estimates.

