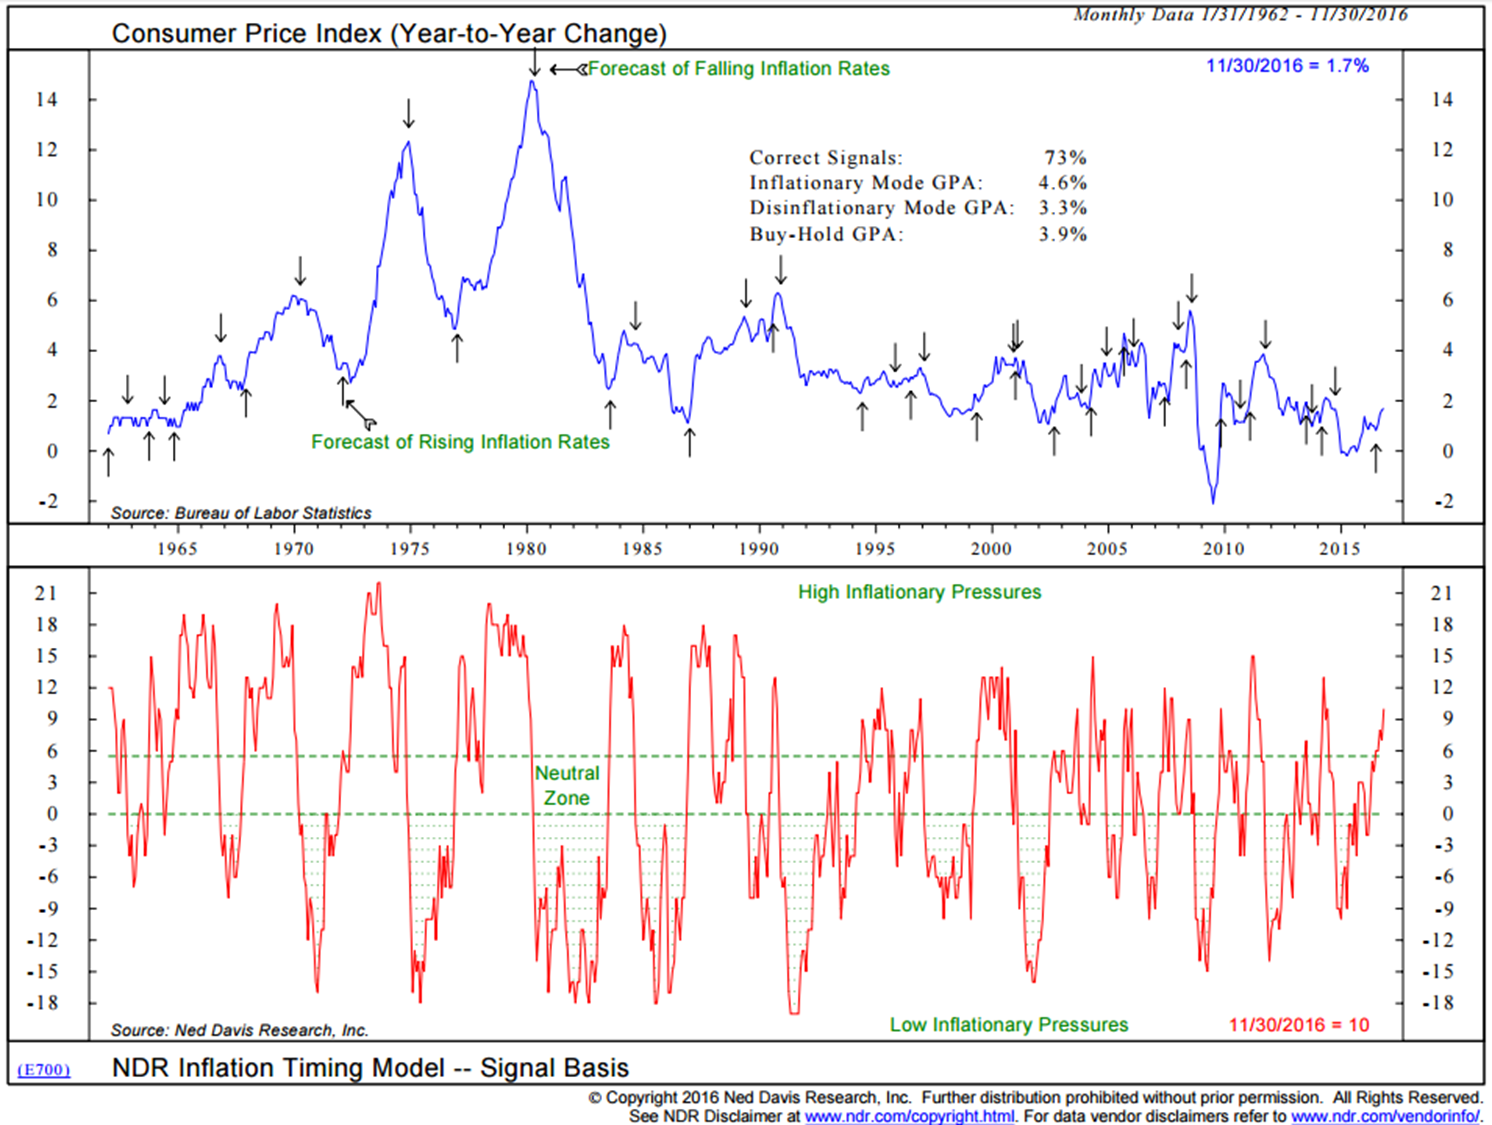
Monitoring inflation is critical since turning points in inflation often determine turning points in the financial markets.
- The Ned Davis Research Inflation Timing Model consists of 22 indicators that primarily measure the various rates of change of such indicators as commodity prices, consumer prices, producer prices, and industrial production. The model totals all the indicator readings and provides a score ranging from +22 (strong inflationary pressures) to -22 (strong disinflationary pressures).
- That data is plotted in red in the lower section of the chart.
- High Inflationary Pressures are signaled when the model rises to +6 or above. Low Inflationary Pressures are indicated when the model falls to zero or less.
- Current reading is “High Inflationary Pressures.”
- Signals in the upper section – up and down arrows.
- Correct signals 73% of the time. Pretty good historical record.
Source: Ned Davis Research (includes disclosure)
Rising inflation is bad for bond investors and generally bad for stocks but is bonds I worry about most today.

