 The chart below tracks the delinquency rate on commercial and industrial loans from all commercial banks on a percent change from the prior year (blue line). It then compares that change to Bank of America/Merrill Lynch US High Yield spread (red line). The spread is simply the current yield minus the comparable yield for a safe investment, like U.S. Treasurys, that has a similar maturity. If the average maturity is five years on the ML HY Index, then the spread is that yield less the five-year Treasury yield.
But don’t get hung up on that. What this chart is telling us is that over time, when delinquencies increase, we see an increase in high yield bond yields. Makes sense, as investors flee the risk they sell. More sellers than buyers causes prices to decline and yields to rise. In 2008, as high yield bond prices collapsed, the yield on high yield bonds rose from 6% to over 20%. What a great buying opportunity that presented. I believe another such opportunity is on the horizon.
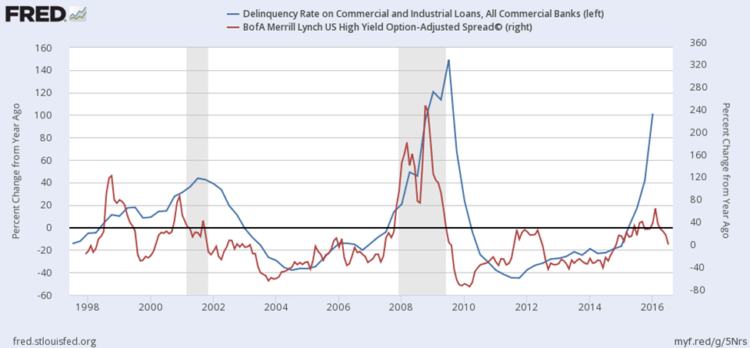
OK, back to the chart. Notice how closely the red line (yields) tracks the blue line (bank loan delinquencies). Also, look at the recent separation (far right). What this is showing is that something has to give. Fundamentals are breaking down. If higher quality and highly collateralized bank loans are seeing a spike in delinquencies, can you imagine what might be going on beneath the surface for little collateralized high yield junk bonds? Defaults are going to rise.
I’ve been tactically trading high yield bonds since 1991. It is a trend following trading strategy — disciplined and rules based. Trade into high yield funds on uptrends, move to short-term Treasury bills on downtrends.
Last week I presented at a large advisor conference. I did my best to explain what is going on and what it means for their clients’ portfolios. For example, let’s say that your client has 15% allocated to high yields. If defaults rise, as I suspect, the collateral and promises from the borrower to pay the bond loan back offer the investor little chance of recovery. I expect a 50% price decline during the next recession. That is good news, not bad – unless one is caught on the wrong side of the trade.
If you have 15% of your money in high yield bonds, expect a 7.5% hit to your overall portfolio depending on the speed of the decline. Declines of this nature tend to happen quickly (over days and months – not years).
Now, if you are in a trend following trading strategy with an experienced manager or you have the guts and conviction to follow a process, then you are smelling great opportunity here. Sidestepping the vast majority of the decline will enable you to trade back in at much lower prices and much higher yields to maturity.
Interest rates are near record lows with the 10-year Treasury at 1.50%. Bonds offer little support to help drive return in a portfolio. Equity market valuations are ultra-high, signaling low 2% to 4% returns, before inflation, over the coming 10 years. Seventy-five percent of the money will be in the hands of pre-retirees and retirees by 2020 (according to BlackRock research). I don’t believe that investors will be content looking at their account statements when interest rates rise and another major correction kicks their portfolio in the pants. But there are ways to make money should what I expect to unfold occurs.
By Steve Blumenthal | For charts, analysis, and commentary see the rest of the story in On My Radar: Junkyard Dogs.
The current opinions and forecasts expressed herein are solely those of Steve Blumenthal and are subject to change. They do not represent the opinions of CMG. CMGs trading strategies are quantitative and may hold a position that at any given time does not reflect Steve’s forecasts. Steve’s opinions and forecasts may not actually come to pass. Information on this site should not be used as a recommendation to buy or sell any investment product or strategy.
