Paul Tudor Jones is one of the greatest traders of all time. Jones’ firm, Tudor Investment Corporation, manages about $13 billion across multiple strategies.
Jones says, “The whole trick in investing is: ‘How do I keep from losing everything?’” To which, he said he would advise investors to “to get out of anything that falls below the 200-day moving average.” Visually, it looks something like this:
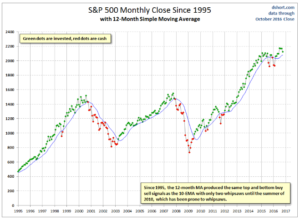
Source: dshort.com.
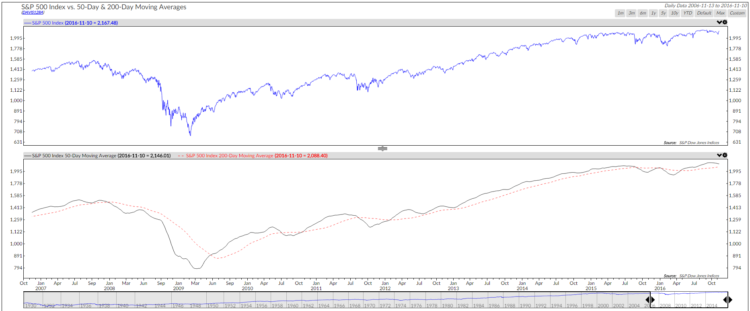
Here’s a trend following idea for you to consider. In the next chart, the black line is the simple 200-day moving average line. The red dotted line is the 50-day shorter-term moving average line. Both are a way of showing us the current price trend. When the 50-day trend line moves above the longer 200-day trend line, the overall trend is bullish. When below, it is bearish.
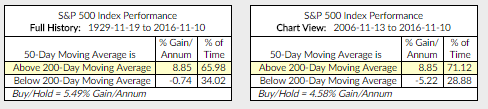
Since 1929, 65.98% of the time, the market trend was bullish and returns highest. Likewise, the data since 2006 shows similar results. The return figures are the percentage annualized gain per year. The yellow highlight shows the regime we are in today. The trend by this measure is currently bullish.