 Today I share with you a great chart that shows the 10-year forward return statistics by quintile based on reported earnings to calculate median P/E (lowest valuations to highest valuations) and we include the market decline statistics in each of those categories. Not surprisingly, you’ll see that the best returns and lowest risk periods were when valuations were low and forward potential return high.
There are ways to invest that enable us all to build stronger, more resilient portfolios. When valuations reach a point that they become attractive again, and they will, then it will be time to overweight equities within portfolios. When they are expensively priced, like today (here), then underweight and hedge equity exposure.
Here is the math we did based on month-end median P/E data. First, we looked at five different P/E valuation quintiles (least expensive to most expensive) and then looked at what the subsequent 10-year annualized returns turned out to be. Second, we looked at the worst case drawdown (i.e. if your stock portfolio worth $100,000 declined to $60,000 before it moved higher again, your drawdown was $40,000 or -40%).
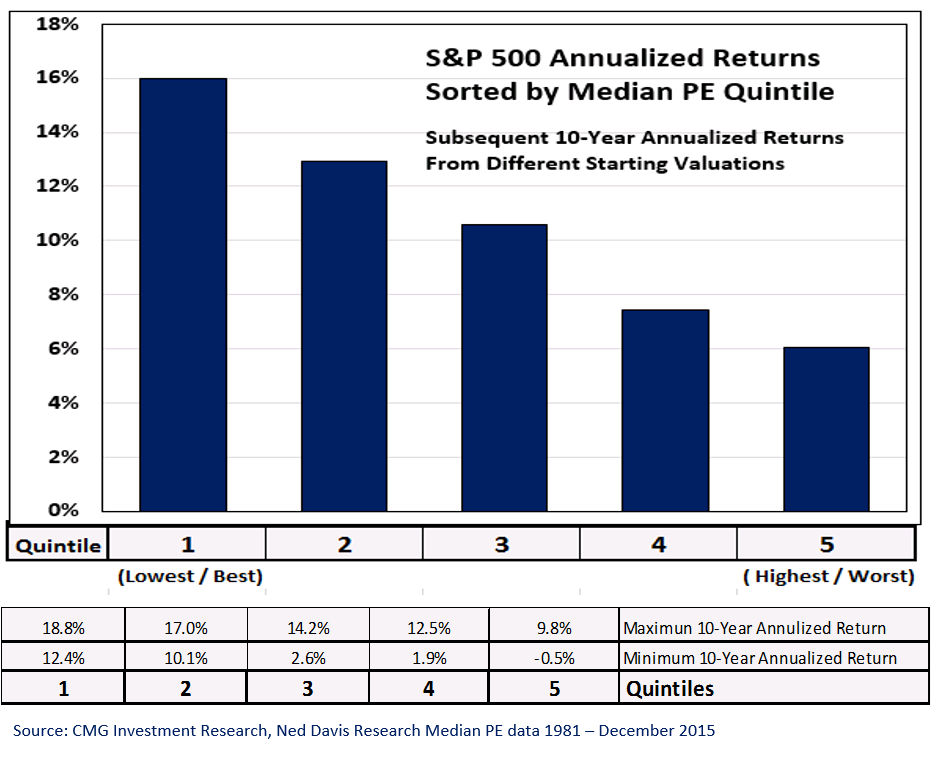
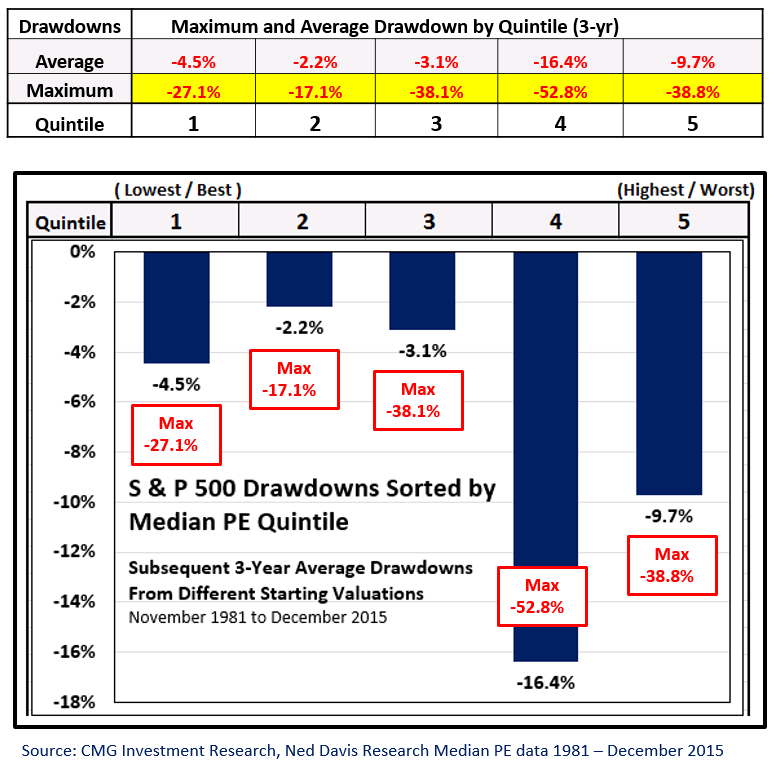
Pretty logical and straight forward. The hard part is setting a game plan for the period in which we find ourselves. In periods of excessive valuation, I favor underweighting equity exposure – say 30%. In periods of extreme undervaluation, I favor overweighting equity exposure – say to 70%. As you can see from the chart above, returns are much greater in quintile 1 and risk is reduced. The exact opposite is true in quintile 5.
So what do you do with the remaining exposure? Generally, fixed income plays an important role; however, today our starting yields are less than 2%. They were 16% when I started in the business in 1984. So we have to take that into consideration.
The current opinions and forecasts expressed herein are solely those of Steve Blumenthal and are subject to change. They do not represent the opinions of CMG. CMGs trading strategies are quantitative and may hold a position that at any given time does not reflect Steve’s forecasts. Steve’s opinions and forecasts may not actually come to pass. Information on this site should not be used as a recommendation to buy or sell any investment product or strategy.
